When exporting a curve or other data from the Smart Function Kit Pressing software, you will get the files in a JSON format. File extension is JSON and the content shows a hierarchically structure.
Extract a curve, either by manual download or via REST-API
Locate the file on your computer.
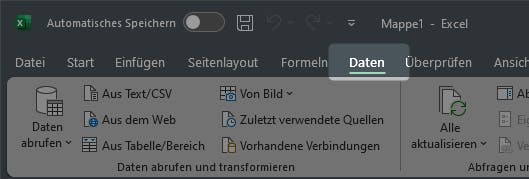
Open Excel and select "Data" (German screenshot: "Daten")
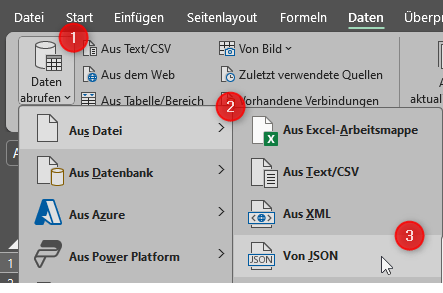
Navigate to "get Data" ("Daten abrufen"), then select "From File" ("Aus Datei") and "From JSON" ("Von JSON").
Select then the JSON file to be imported.
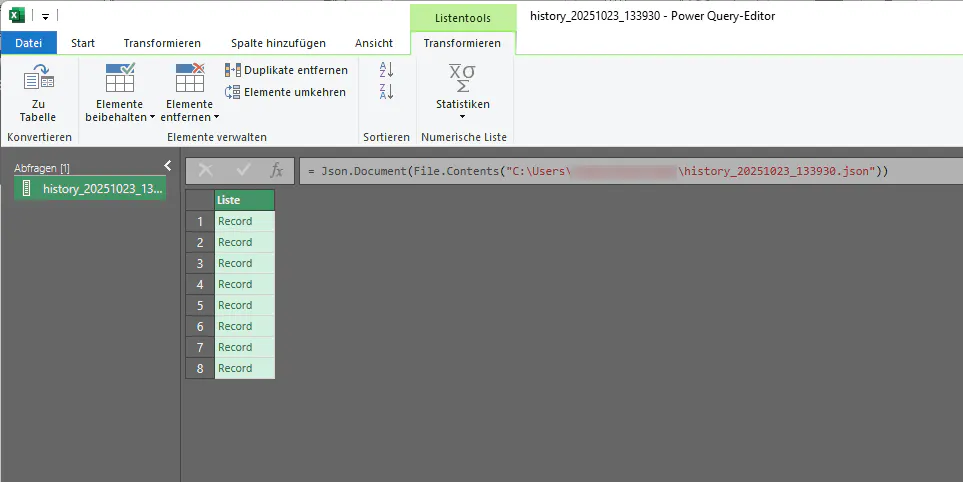
A new window opens. Here, you can see and select the data to be imported. We will import the history overview next.
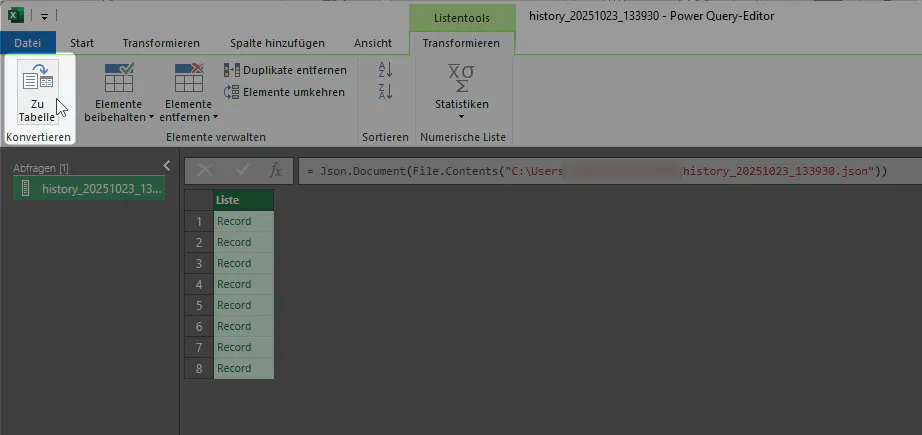
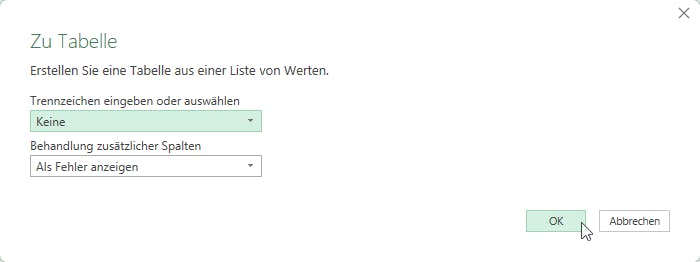
Click there to "Convert to Table" ("Zu Tabelle konvertieren")
Click "OK" next or select other options
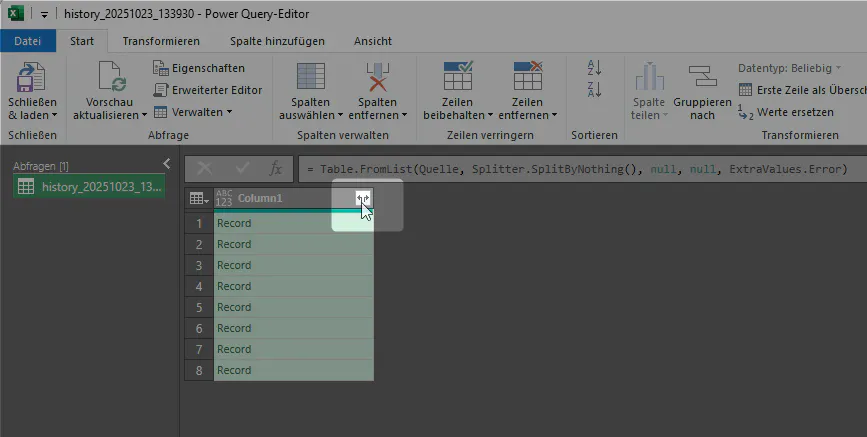
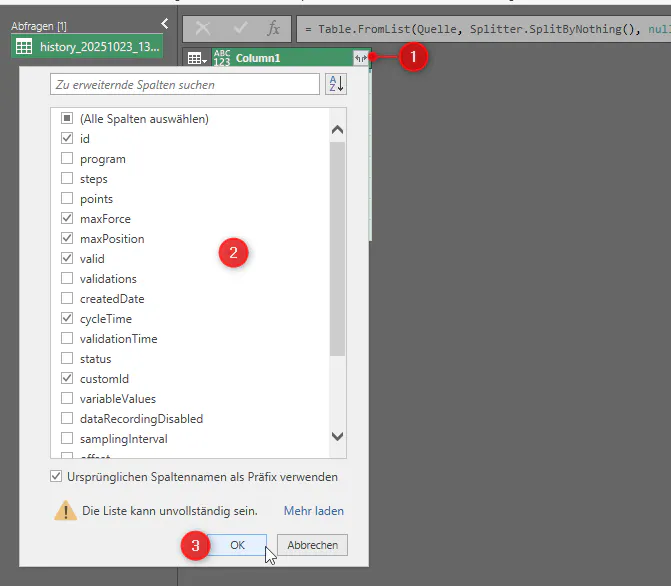
You will see next the extracted data. As there is hierarchy in that dataset, we need to expand the data. Click the button in the column header
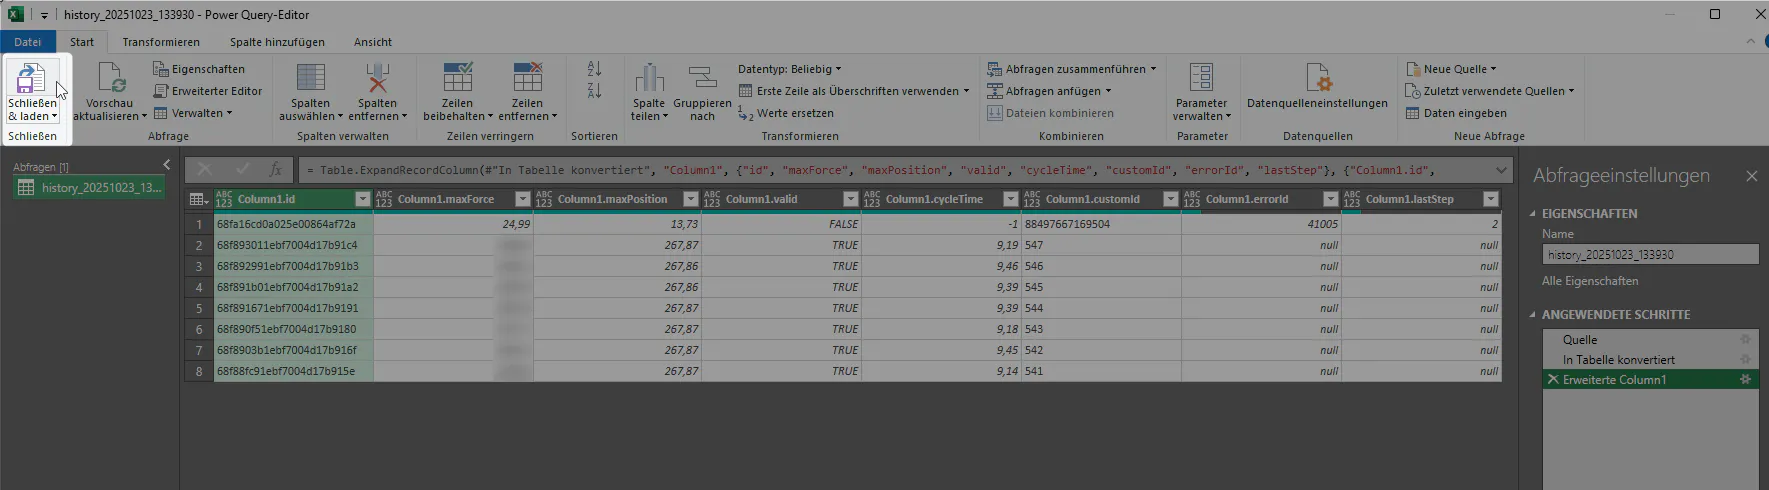
Select the data to be extracted and confirm with OK. For an overview about the production, select for example: id / maxForce / maxPosition / valid / cycleTime / customId / ... (see below if you want to import the points or other arrays)
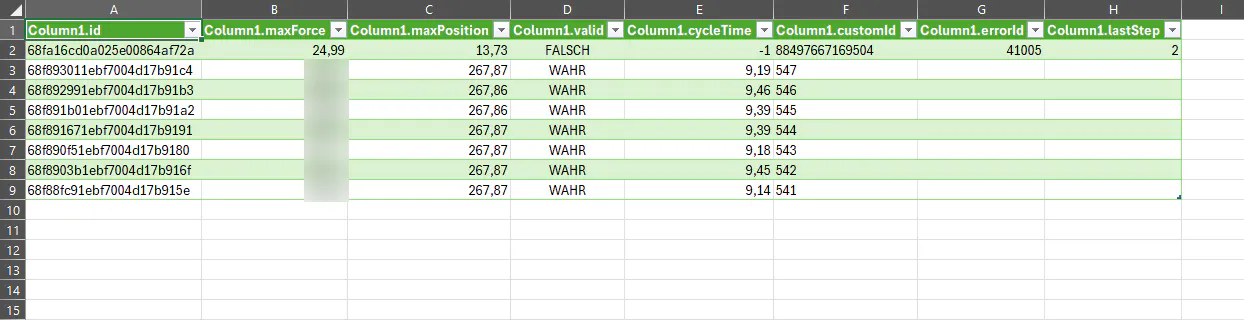
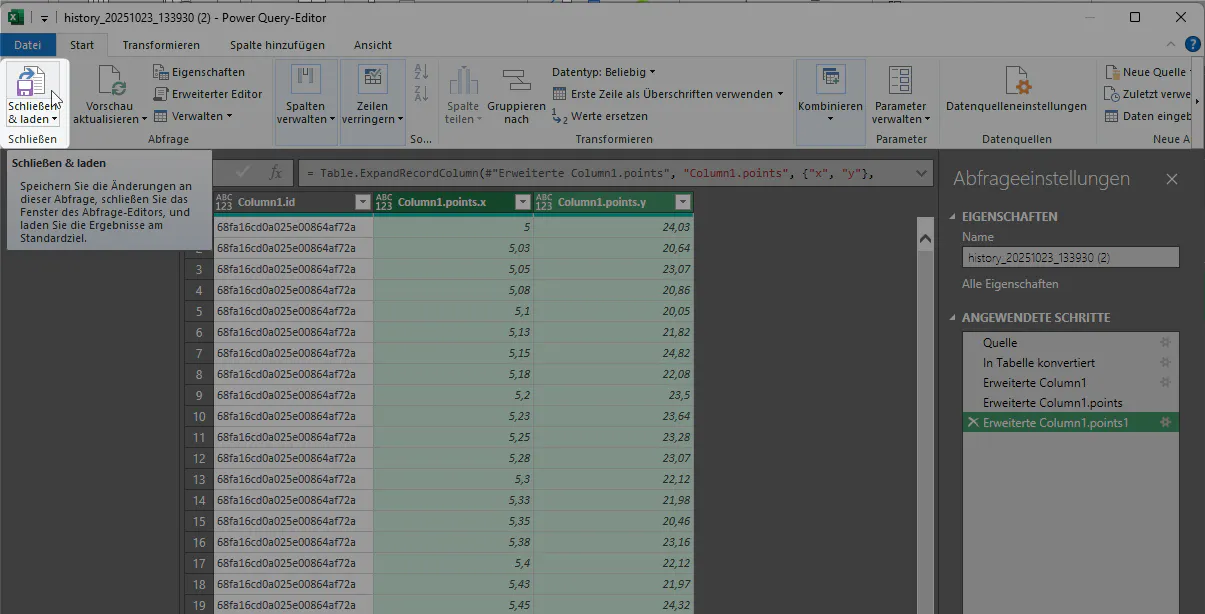
The selected data is now extracted. Copy to your Excel sheet with "Close & Load" ("Schließen & laden")
Finish! The data is available now in the Excel sheet.
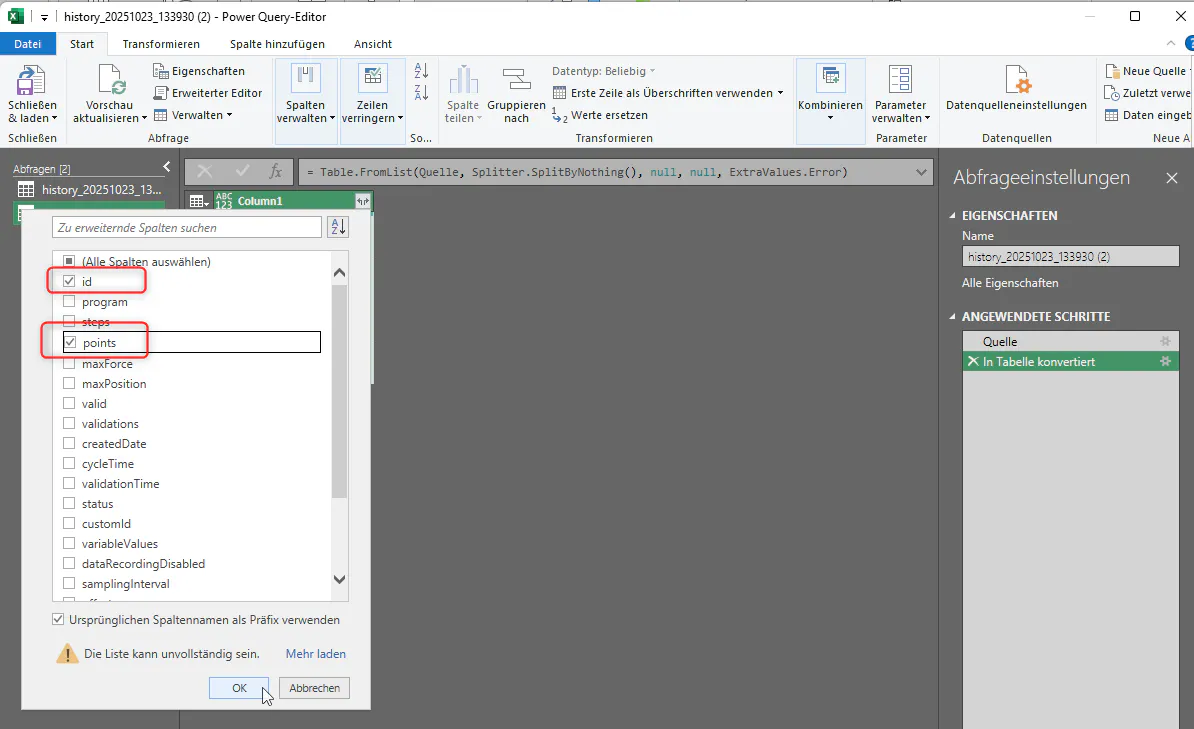
Additional steps to import points (see point 10ff):
select points
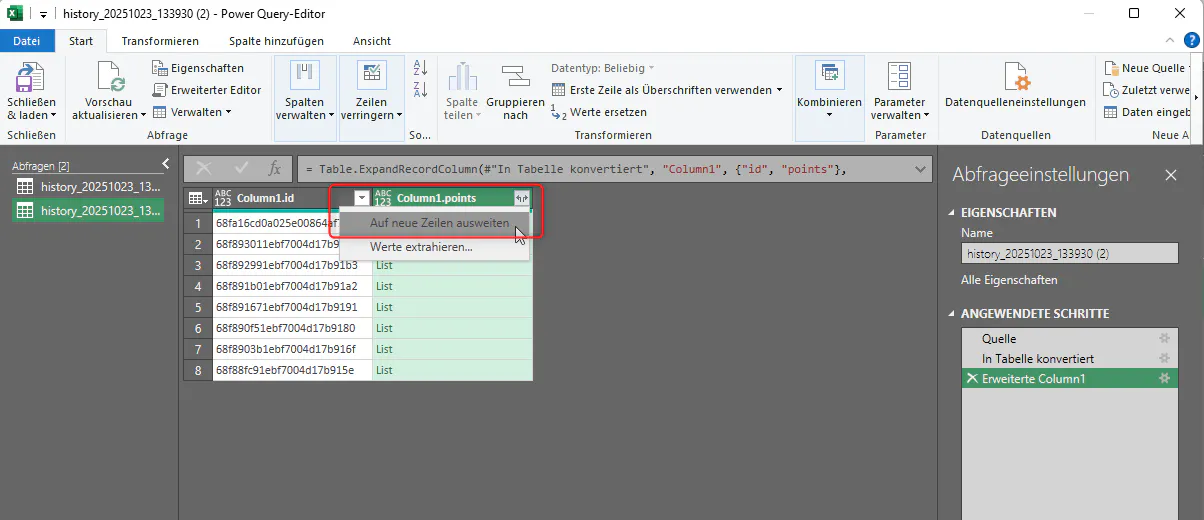
select "extend to new lines"
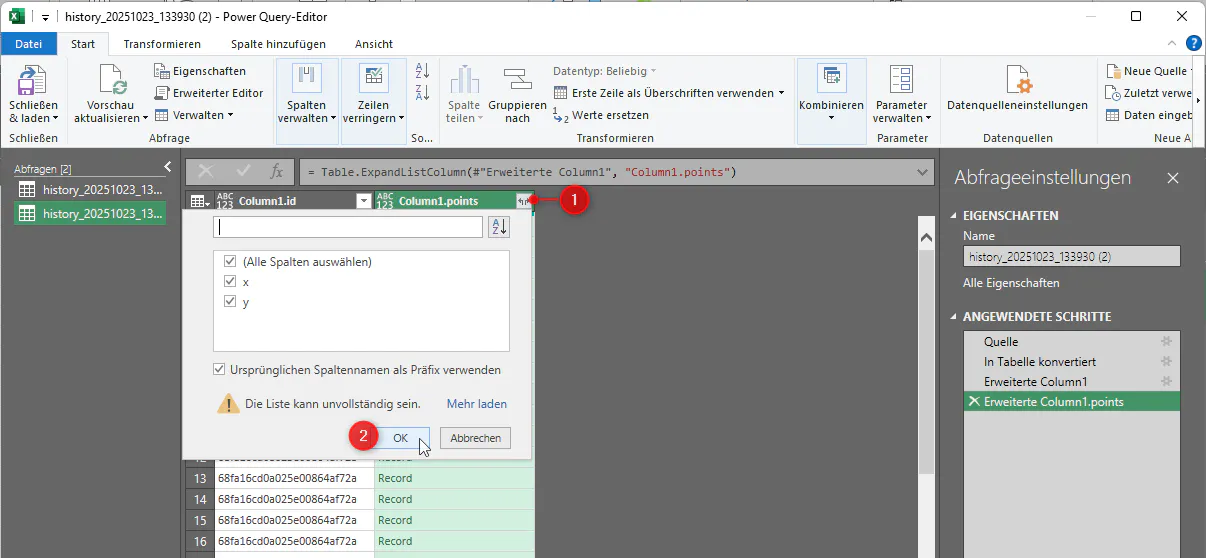
select "points" again
save and load
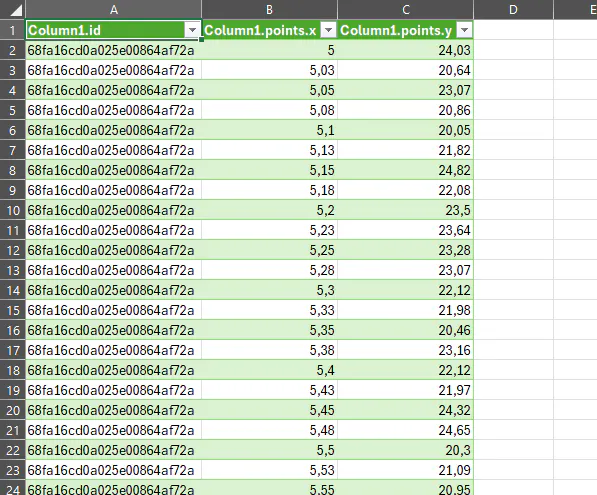
Data is now in a table:
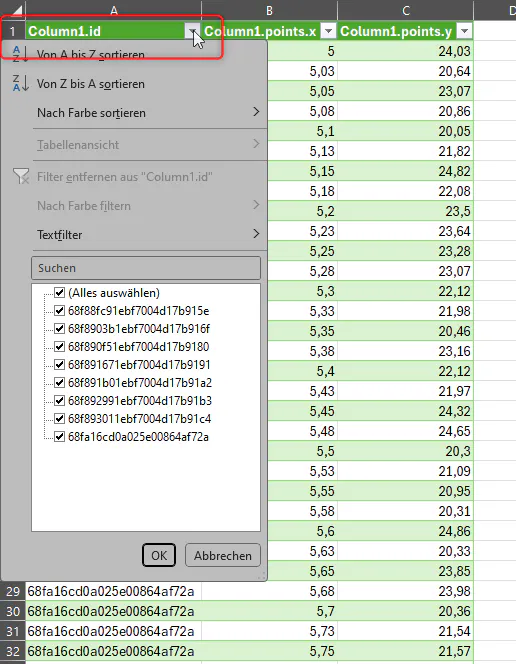
You can filter now by curve.id or your own serialnumber or other selected fields
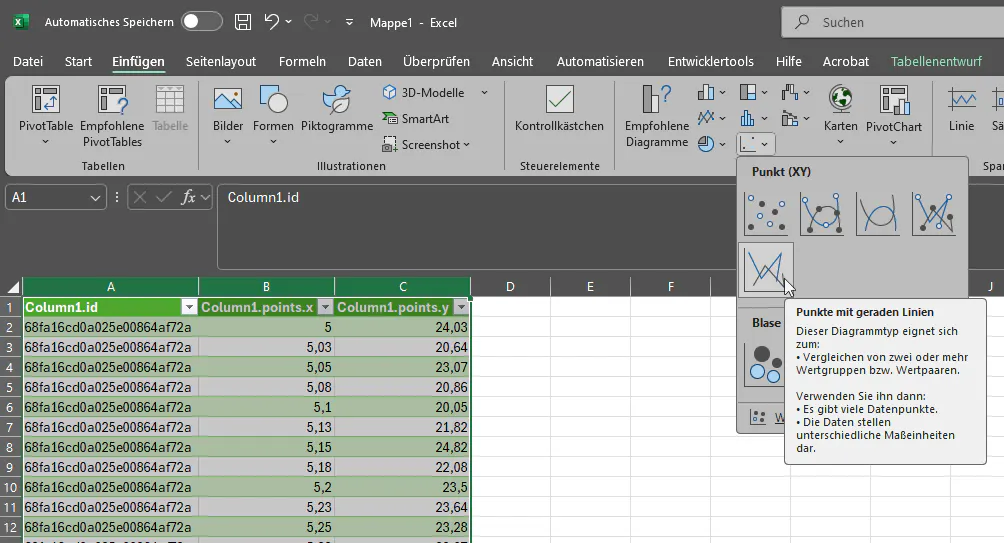
to see the data in a time series, mark all data and add "Point (XY)" chart
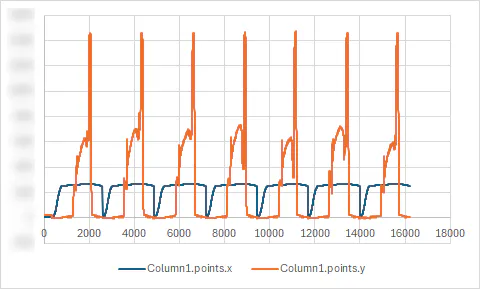
You can manually overlay the curves now or use the PivotChart/PivotTable functionality.